Metrics ✅ Logs ✅ Traces ✅ Alerts ✅
Observability that's easy - full stop.
Send metrics, logs and traces from a single HTTP request. Configure dashboards, search logs, view traces, set up alerting. Sign up and get 1,000 credits free.
No card, no agent, nothing to install. Nothing is ever charged to your card automatically.
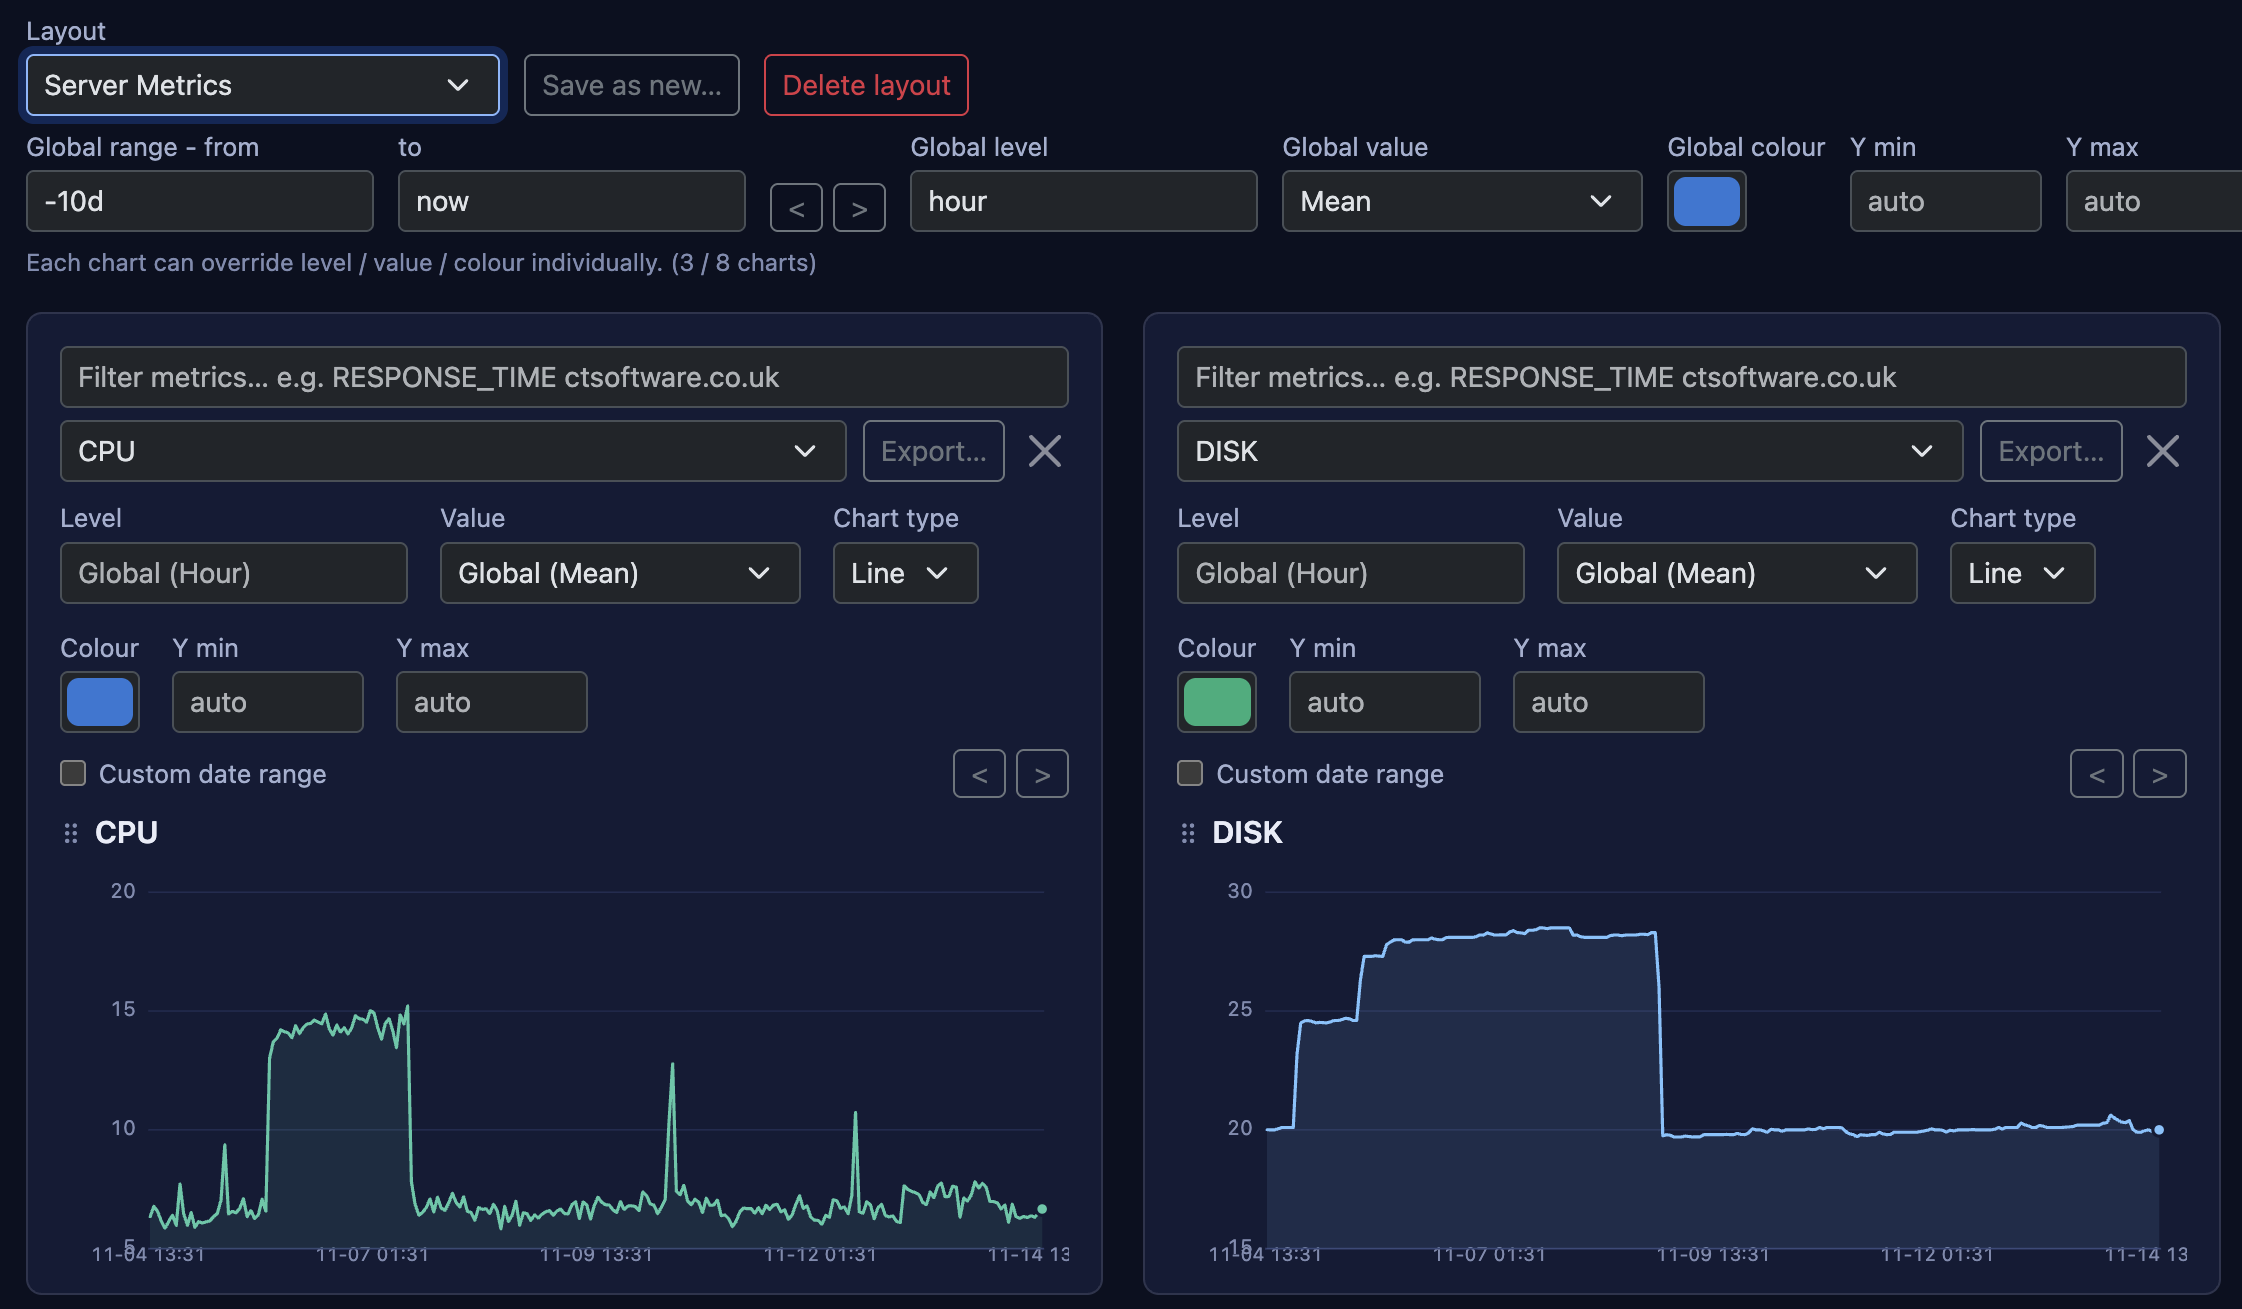
How it works
curl -X POST https://easy-obs.com/api/metric/ \
  -H "Authorization: Bearer YOUR_API_KEY" \
  -H "Content-Type: application/json" \
-d '{"metric": "signups", "value": 1, "auto_create": true}'Send
Use the JSON REST API inside your app. Create multiple of any quantity in one call. Metrics can be auto-created.
 2
See
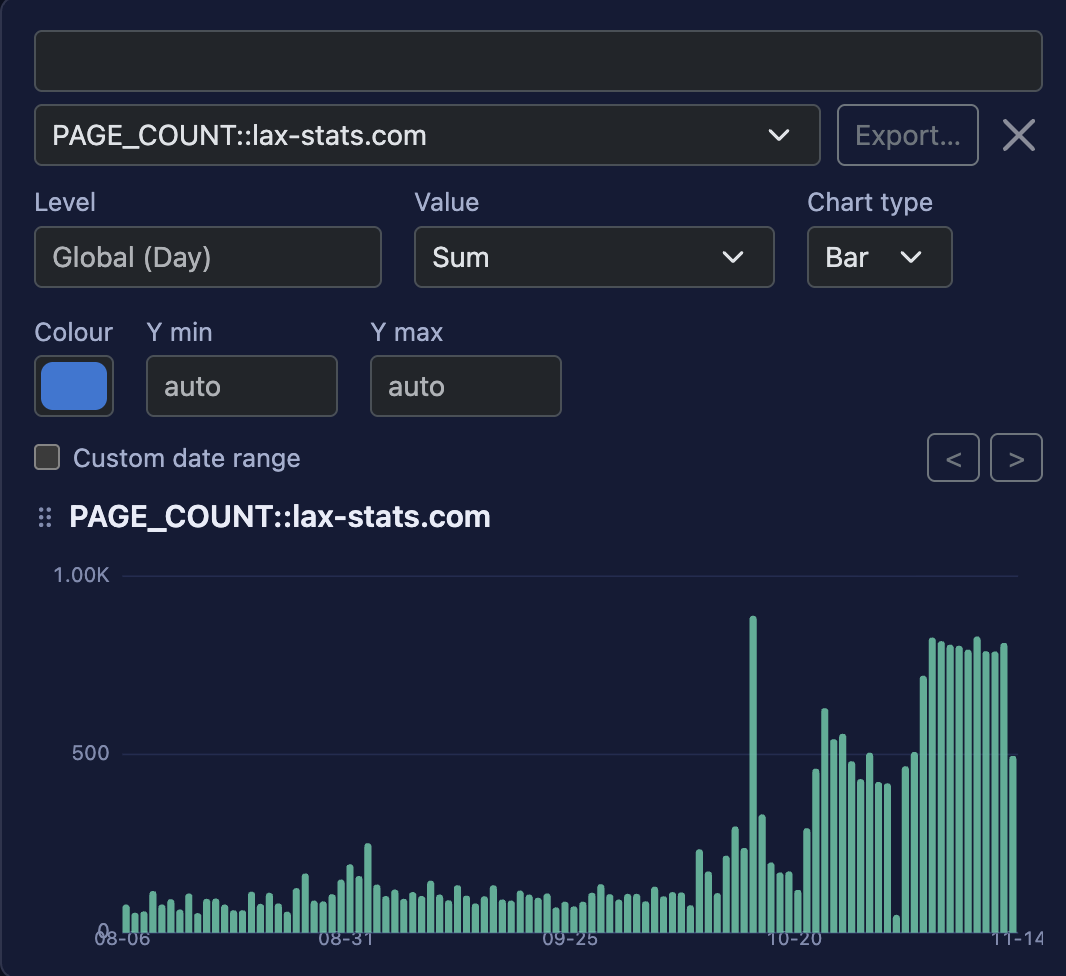
Configure dashboard charts for metrics, create custom exports of logs, and flame charts for traces - all 100% in your browser.
 3
Sort
Configure alerts on any relevant thresholds so you can remediate warnings before they become problems.
What you get
Time-Aggregated Metrics
Every metric value has a timestamp, and we auto-aggregate them by minute / hour / day / month / year. Each aggregate calculates count, sum, mean, min, max, and more. Distinct-count is also possible - to configurable degrees of accuracy.
Logs
Simple logging app that supports multiple standard formats. Fully searchable and exportable.
Traces
Send nested spans and open any trace as a flame chart, to see where the time went.
Derived metrics
Combine metrics with an expression e.g. {ERROR_RATE = HTTP_ERRORS.count / HTTP_REQUESTS.count}, then chart the result like any other.
Dashboards you save
Arrange charts into saved layouts, share links to colleagues, and monitor the situation.
Alerts
Configure alerts on any relevant thresholds so you can remediate warnings before they become problems.
Pricing you can predict
New accounts start with 10,000 free credits. More credits can be purchased anytime. Try the calculator to plan ahead.
| What you use | Credits | $ / month |
|---|---|---|
| 1 metric kept to year -> day level | 45 credits | $0.045 |
| 1 metric kept to year -> minute level | 150 credits | $0.15 |
| 20 metrics kept to year -> day level | 900 credits | $0.90 |
| 10,000 logs a day, kept 1 day | 600 credits | $0.60 |
| 10,000 logs a day, kept 7 days | 4,200 credits | $4.20 |
| 1,000 traces a day, kept 1 day | 120 credits | $0.12 |
| 1,000 traces a day, kept 7 days | 840 credits | $0.84 |
| A small app: 20 day-level metrics with 1,000 logs and 100 traces a day | 972 credits | $0.972 |
Buy credits with a one-off card payment, billing runs every hour pro-rata. If credits run out, further requests will be rejected. See the full price list →
Price Calculator
Enter your expected usage to see an estimated monthly cost.
Python SDK
You don't need to use it - plain HTTP requests work fine - but if you're on Python, there's a small SDK that does the requests for you: metrics, logs, traces, and a handler for the standard logging module. It's on PyPI and the source is on GitHub.
pip install ct_obs_appThe package is named ct_obs_app; you import it as obs_app_sdk. Your API key is on the Account screen of the app.
from obs_app_sdk import Client, CaptureTrace

client = Client(api_key="YOUR_API_KEY", base_url="https://easy-obs.com")

# a metric - created the first time you send it
client.add_metric(value=182, metric="checkout_ms", auto_create=True)

# a log, with the level (1 = critical ... 5 = debug) and anything else worth searching on
client.log("Checkout completed", level=4, app="shop", extra={"order_id": 42})

# a trace: nested blocks become one flame chart, sent when the outer block ends
with CaptureTrace(client, "handle_checkout"):
    with CaptureTrace(client, "charge_card"):
        ...
    with CaptureTrace(client, "send_receipt"):
        ...
Use it with Python's logging
Every record on the logger becomes a log entry, at the matching level, with the logger's name.
import logging
from obs_app_sdk import Client, ObsAppLogHandler

client = Client(api_key="YOUR_API_KEY", base_url="https://easy-obs.com")
logging.getLogger().addHandler(ObsAppLogHandler(client, app="shop"))

logging.getLogger(__name__).warning("Stock is low")  # now in your logs, at the right level
Without slowing your app down
By default each call waits for the response and raises if something is wrong: a bad key, invalid data, or being rate-limited. With background=True calls return immediately and are sent from a background thread instead. Errors can no longer be raised to your code, so they go to your on_error function, and anything still queued when the process exits can be lost. Use it for logs and metrics you can afford to drop now and then.
client = Client(api_key="YOUR_API_KEY", base_url="https://easy-obs.com", background=True, on_error=print)
client.add_metric(value=1, metric="page_views", auto_create=True)  # returns at once; sent from a background thread
Questions, answered
What is Easy Observability?
A hosted service for metrics, logs and traces. You send data to a plain REST API with an API key - there is no agent or app to install - and see it in dashboards, a searchable log view and trace flame charts.
How much does it cost?
There are no per-host, per-seat or per-gigabyte charges, and you start with 10,000 free credits. Add more credits any time as necessary, and use the pricing calculator to plan ahead. Each level of a metric costs 15 to 75 credits a month at its default retention (a day level is the cheapest, a minute level the dearest), and 500 logs, or 250 traces, kept for a day cost 1 credit.
Do I need a subscription?
No. You buy credits when you want more with a normal one-off card payment, and use them as you go. Credits don't expire, and nothing is ever charged to your card automatically, so there is no surprise bill: the most you can spend is what you have chosen to buy. Signups get a generous amount of free credits to start with.
How is usage counted?
Billing runs every hour - the logs and traces you are holding, and the metrics you have - and its credits are taken from your balance. It is rent for what exists: a log kept 7 days is held for 7 days, so costs 7 times one kept 1 day, and a metric you create or delete part-way through the month only costs for the time it existed. Each hour is rounded down. The app shows your usage day by day.
What happens if I run out of credits?
Your metrics pause - they stop recording until you buy more, and restart as soon as you top up - and new logs and traces are refused with a clear message. Nothing is deleted.
What does keeping data longer cost?
Costs scale linearly with retention time, so you can tailor your setup to your needs and budget.
Why is pricing per metric rather than per host or per gigabyte?
Because it is the number you can predict. A metric is identified by its name alone - it has no tags or labels - so its price never grows because of what you put in it, and a busy day costs the same as a quiet one. If you want a breakdown, create separate metrics (for example checkout_errors_uk and checkout_errors_us).
How do I send data?
The REST API has endpoints for each of /logs/, /metrics/ and /traces/, and it also has a multi-endpoint for sending all three types in one request - ideal for a post-request hook.
What are minute, hour, day, month and year levels?
Each metric is rolled up automatically into totals per minute, hour, day, month and year - count, sum, mean, minimum, maximum and more - and you choose which levels to keep and for how long. What sets the price is the levels you keep and for how long - each level is priced separately and they are added up. A level costs 15 to 75 credits a month when kept for its default (minute 1, hour 7, day 30, month 365, year 3,650 days) - finer levels hold more data, so they cost more - and in proportion to that for more or fewer days: minutes kept 3 days is 225 credits a month, hours kept 14 days is 60 credits a month.
What is a distinct count, and how accurate is it?
For any level you can switch on a distinct count, which counts how many different values a metric saw in each minute, hour or day. This is very useful for e.g. counting unique user ids for DAU / MAU stats. Note that there is a price premium for using distinct counts, due to the large amount of data they require.
What do I get free?
10,000 credits when you sign up (1,000 for a guest account, which can't buy more). For example, 10,000 credits covers 5,000,000 logs, or 2,500,000 traces, or 10 metrics kept down to the minute for 200 days.
Can I try it without signing up?
Yes - choose "Continue as guest" when you open the app. A guest account starts with 1,000 credits and is deleted, with everything in it, after 24 hours. Create an account to keep your data and to buy more credits.